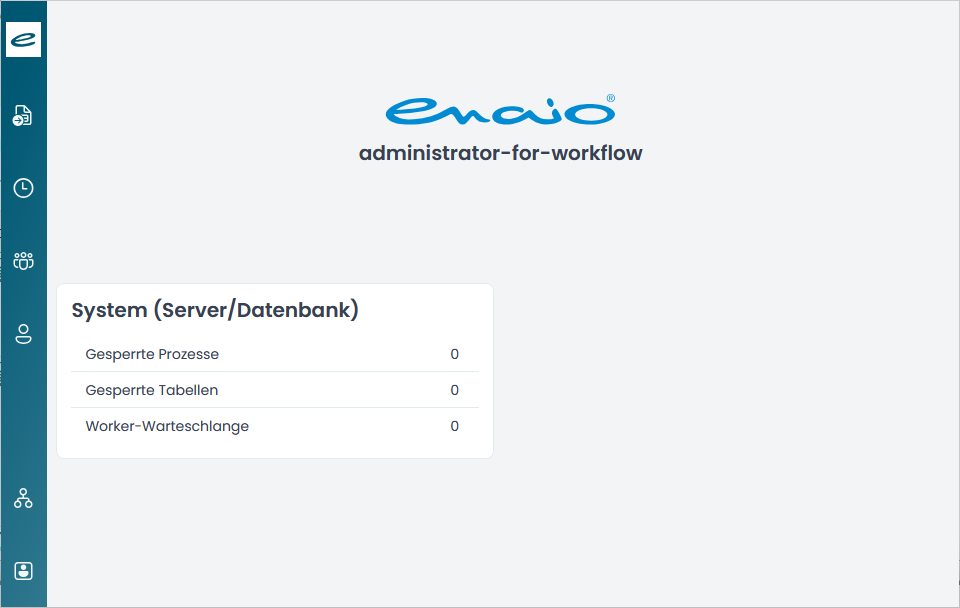
enaio® administrator-for-workflow (web)’s dashboard provides an informative overview of the state of the database and the workflow engine through a system overview featuring statistical analyses, charts, and a search function.
The dashboard consists of the following areas:
-
System (server/database)
Click the buttons Locked processes, Locked tables, and Worker queue to display the corresponding views with detailed information.
 Locked processes
Displays an overview of the locked processes in a list. The list of locked processes can be sorted and filtered by process, lock time, server, and thread ID. The modified list layout can be reset. The locking of selected processes can be removed.
Locked tables
Displays an overview of the locked tables in a list. The list of locked tables can be sorted and filtered by table, status, lock time, server, and thread ID. The modified list layout can be reset. The selected tables can be unlocked.
Worker queue
The worker queue is an internal server mechanism for handling processes. It displays an overview of all elements in the queue. The list can be sorted and filtered by activity, activity status, target activity status, process, creation time, lockedstatus, lock time, and server. The modified list layout can be reset.
Using the keyboard shortcuts Ctrl + left mouse button, you can open the views in a new browser tab.
-
Search for process using object ID
Allows you to find processes using the object ID of business objects stored in workflow files (see Object ID Search).
-
Number of processes
The pie chart provides a statistical overview of the number of current processes, broken down into running, suspended, and paused processes. When you move your mouse over the
 Reload icon in the chart or over the segments of the pie chart, the tooltips will display the time of the last update or the number of running, interrupted, or suspended processes.
 -
Process time (days)
The column chart provides a statistical overview of the minimum, average, and maximum process durations. When you hover your mouse over the
Reload icon in the chart or over the individual segments of the column chart, the tooltips will display the time of the last update or the duration of the process runtimes in weeks, days, and hours.
The statistical data on the dashboard (e.g., locked processes/tables, charts, etc.) is automatically updated every 24 hours.
Customizing Dashboard Charts
By clicking the  'Statistics settings' icon above the charts, the user can select the processes to be statistically analyzed and displayed in the charts. After the user has made changes using the Select workflow families dialog, enaio® administrator-for-workflow (web) automatically updates the display in the charts. The
  Loaded! icon indicates that the chart is being updated.
 on the right.
 areas. Use the toolbar to show all hidden areas at once:
