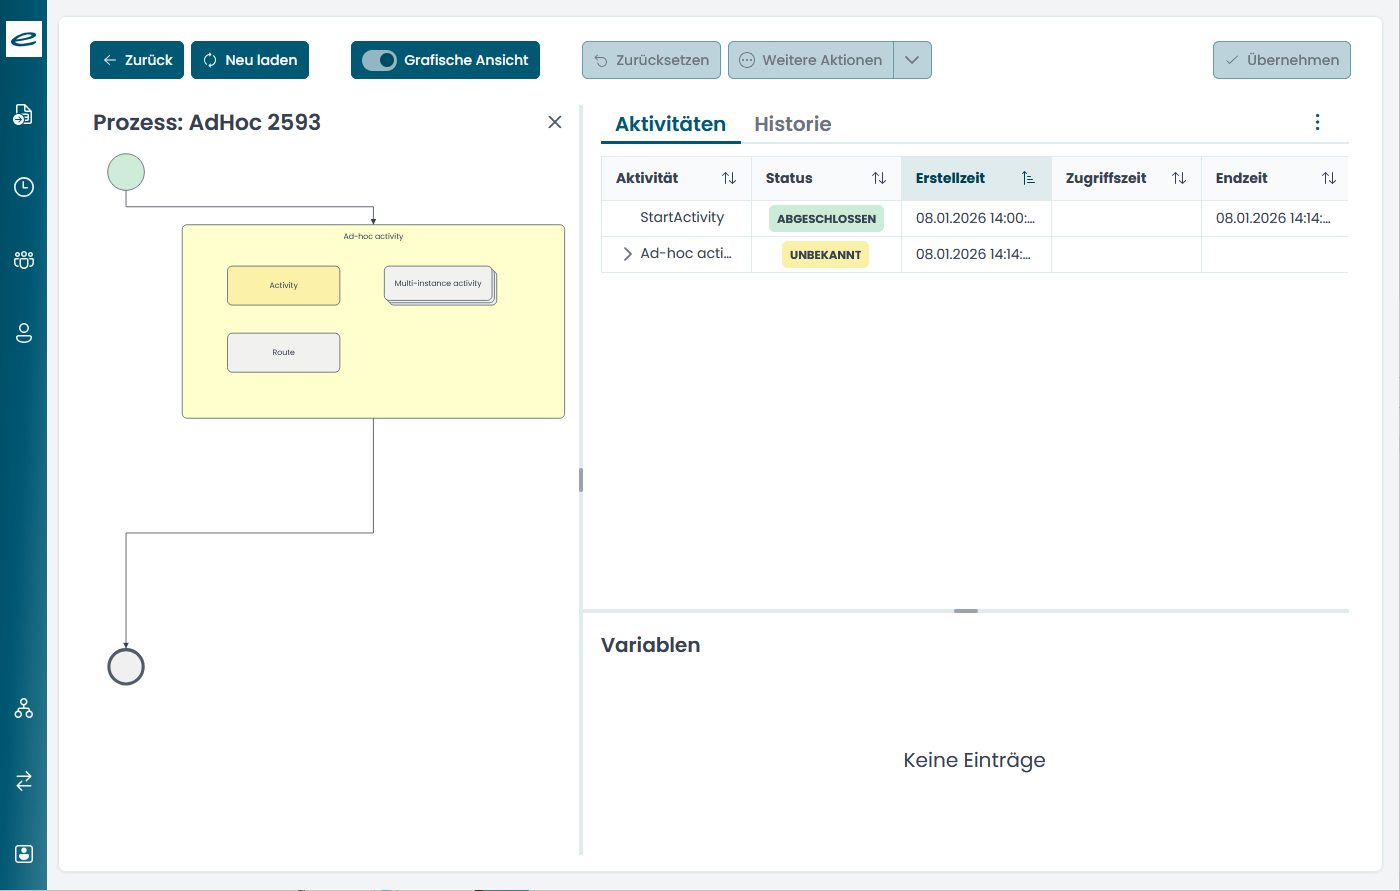
The graphical view displays a model of a selected process in the form of a flowchart. Within the graphical view, you have access to functions for editing activities (see Editing Activities).
The graphical view is available only in the details view in the  Active models area (see Active Models Area – Details View).
 To open the graphical view, follow these steps
-
Click the
Active models icon in the main menu.The submenu containing all active models opens.
-
Click the model you want in the submenu.
The workspace displays the model’s process overview table, which lists all active processes.
-
Open the details view by selecting the desired process in the process overview table and
-
Click the
 Properties button above the process overview table.
 -
Click the
Properties option in the context menu of the selected process. -
Double-click the selected process in the process overview table.
The details view of the process opens.
-
-
In the details view, the graphical view of the selected process is open by default. If it is not, slide the
 Graphical view slider to the right.
The graphical view of the selected process opens.
The flowchart shows the various activities of the selected process between the start and end points. Each activity is uniquely identified by its shape, color, and additional icons.
| Shape | Name | Description |
|---|---|---|

|
Start and end activities |
Displays the start or end activity of a process. The start activity is the starting point of the first transition. It does not need to be further configured. The start activity has no participants. Which users are allowed to launch a process of a model is configured in the model properties. The end activity is the end of the process. You configure the transfer of variables for the end activity. The start and end activities cannot be deleted. |

|
Participant activity |
A specific work item in a process that requires manual intervention, decisions, or user input in order for the process to continue. A participant activity can be edited by only one participant. |

|
Multi-instance activity | Multi-instance activities are activities to be found in the inboxes of all specified users who can also execute them. As soon as all participants have forwarded their activity, the following activity will start. Since many participants perform this activity at the same time, it is usually necessary to work with local variables and consolidate the individual values using an EndActivity event (see Multi-Instance Activities). |

|
Loop activity |
Activities or actions that are repeated multiple times until a defined condition is met or all items in a list have been processed. In addition to an entry point and an exit point, loop activities have a loop exit point and a loop entry point for loop transitions (see Loop Activities). |

|
Route | Routes are support activities which are required within loops to merge data. You need to set up the variable transfer. Routes have a starting point and an end point for transitions. |

|
Ad-hoc activities | An ad-hoc activity is an area where you can arrange multiple participant activities and multi-instance activities. The activities within the ad-hoc activity are not linked by transitions but are strung together by the user (see Ad-Hoc Activities). |
Activities in the graphical view are color-coded to help distinguish their statuses from one another. The color coding corresponds to the color highlighting in the Activity table > Status column.
| Color | Name | Description |
|---|---|---|

|
Blue |
Indicates that an activity has been created (e.g., “Work item created,” “Container created,” “Process step created,” etc.). Loop activities are also marked in blue while they are running. |

|
Yellow |
Indicates suspended or unknown activities. |

|
Gray |
Indicates activities or areas that have not yet begun (e.g., end activities, transitions, and elements that have not yet started). Activities marked in gray cannot be selected in the graphical view. |

|
Green |
Indicates that an activity has been successfully completed. Completed loop activities are also marked in green. |

|
Orange | Indicates activities that have been personalized. Personalized activities are also marked with icons. |

|
Red |
Indicates that a process or activity has been interrupted or that an error has occurred. |
Some activities are marked with icons to make it easier to distinguish them from one another.
| Icon | Name | Description |
|---|---|---|

|
Work item personalized |
Indicates in the graphical view that a work item has been customized by a user. You can use the context menu to show the assignee or to remove the personalization from the work item and assign it to another assignee. |

|
Work item created |
Indicates that a work item has been created. You can use the context menu to show the assignees and assign the work item to other assignees. |
When you select individual activities in the flowchart, the corresponding entries and variables are displayed in the activity table and the variables area. When you close and then reopen the graphical view, the selections made in the flowchart and the table are retained.
Customizing the Graphical View
The size of the graphical view can be adjusted using the handles. This setting is automatically saved when you close the graphical view and when you close the details view.
You can scale the elements of the graphical view by positioning your mouse pointer over the graphical view and using Ctrl + mouse wheel. If you have clicked the graphical view with the mouse or selected an element in the graphical view, you can also scale the elements in the graphical view using the keyboard shortcuts Ctrl + + or Ctrl + -. This adjustment will not be saved.
 on the right.
 areas. Use the toolbar to show all hidden areas at once:
