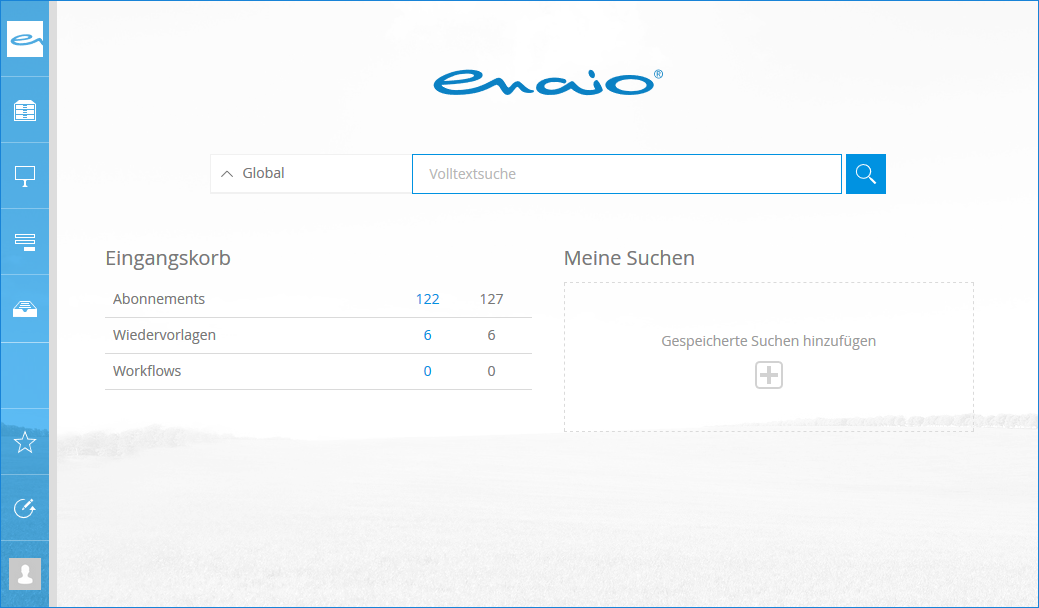
The dashboard shows the most important application information and searches at a glance. You open the dashboard using the enaio® icon in the main menu.
The dashboard is divided into three areas:
The main area of the dashboard displays the search field for the full-text search. The full-text search can be performed globally, i.e., across the entire dataset of the system, or restricted to one cabinet.
You can find information on how to run a full-text search in Full-text Search.
The Inbox area lists the number of existing subscriptions, follow-ups, and workflows. The unread items are indicated by a number shown in blue.
You can open the individual inboxes by clicking the relevant row in the Inbox area.
In the My searches area, you can file saved searches with and without variables from the Desktop and the
Quick search area of the main menu for quick access.
You can run the saved search by clicking or tapping on the corresponding entries in the My searches area. You can extend saved searches with variables by clicking or tapping on the Arrow icon, entering values into the variables fields, and clicking or tapping on Search.
You can find information on how to set up and manage saved searches in the My searches area in My Searches.

 areas. Use the toolbar to show all hidden areas at once:
