Debugging
Debugging is only possible if Visual Studio is installed. Visual Studio is available with different licensing models.
To test events, activate the debug mode in enaio® client. Events are not executed in debug mode; instead the event editor will open the script of the respective activity. The script can be then executed step by step; however, current variable values will be displayed and values can be changed.
The script cannot be edited in debug mode.
Scripts, which are integrated in a workflow process, can be opened in the event editor and performed step by step, in addition to application-related and object-related events.
The debug mode for application-related events is activated in the Settings area. To do so, select the Debug application events option in the More area.
|
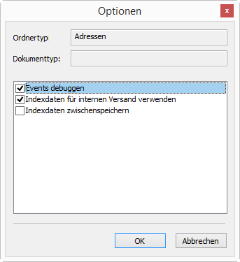
The debug mode for single object types is enabled in the Options dialog, which is opened through the context menu. Select the Debug events item. |
|
To test workflow scripts in debug mode, open the Settings area and select the Debug workflow events option in the More section.
Provided that the debug mode is active, a confirmation dialog will open once a respective event is triggered.
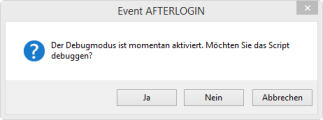
Click Yes to confirm the debug mode; click No to let the event be executed; and click Cancel to continue without the event.
When confirming the debug mode, the script will open.
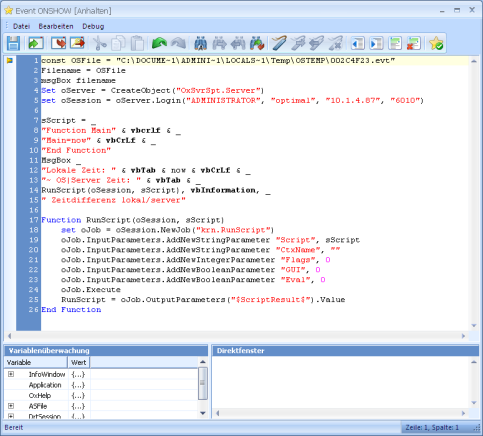
The window is divided into three areas in debug mode: the script and Variable monitoring areas, and the Direct window.
The Variable monitoring area provides all variables, objects, and values that are available in the current script. The data cannot be edited.
The Direct window can be used to check expressions and change variable values:
-
Enter an expression and confirm with Enter to verify the expression.
-
Assign a value to the variable and confirm this with Shift+Enter to change the value of the variable.
Test the event script with the following buttons:
|
F9 |
Breakpoint on/off |
|
F5 |
Start debugging until the next breakpoint or until the end |
|
Shift+F5 |
Exit debugging |
|
F8 |
Jump to call or function |
|
Shift+F8 |
Execute next statement in one step |
|
Ctrl+Shift+F8 |
Step back, jump out of the function |
Press the key combination Ctrl+B to open the Breakpoints dialog in which all defined breakpoints will be listed.
 areas. Use the toolbar to show all hidden areas at once:
