Server – Advanced Administration
You can find a wide range of information about system processes in the Advanced administration area. This information can be useful for system optimization and error analysis.
The area is divided into the following sub-sections:


Performance Parameters
The Performance parameters area provide information on processes, job threads, and loaded modules.
Process Information
This area displays detailed information on the process thread in which the server is running.
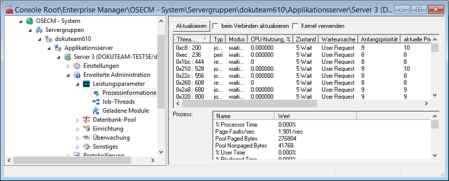
Here, you can find out whether or not computer load is too high.
Job Threads
All queues that are used by enaio® server are listed here.
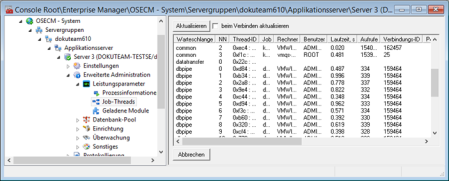
You can determine which jobs are processed in which threads of the queues and the current status of each job.
If you select an entry, you can cancel the job execution.
Loaded Modules
All libraries loaded by the server are listed here. Libraries from the System32 directory can be hidden.
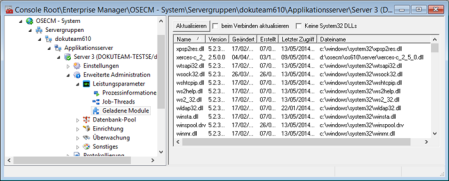
This view allows you to check the versions of libraries and the path from which they are loaded.
Database Pool
The Database pool area displays information on piping and read threads.
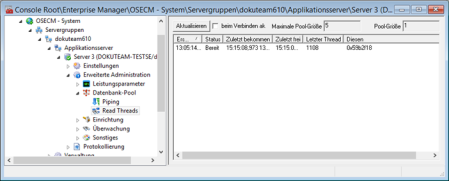
Piping
The current status of the database connection is shown. The maximum pool size is preset to '128'. The current pool size is indicated and connections are listed.
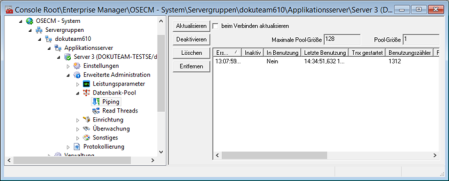
You can use this view to resolve 'hanging' transactions of a connection step by step.
In step one, the transaction can be disabled. The server will not continue to process the transaction and wait to determine if the current job of the transaction can be terminated.
In step two, you can delete the transaction, i.e., the server will terminate it.
The connection can be removed, or terminated, in step three.
Read Threads
The current status of the database connection for the read threads is shown. The maximum pool size is preset to '5' and can be edited in the Server properties > Category: Data area if the connection is subject to heavy traffic.
The current and maximum pool size is shown and connections are listed.
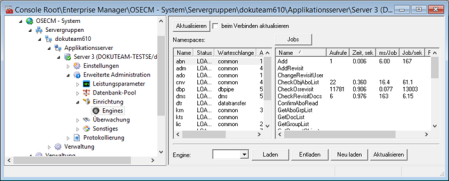
Setup/Engines
All loaded engines are listed here. An engine's number of job calls is listed along with other parameters related to the engines. If you select an engine and press the Jobs button, you can show all engine jobs with the number and properties of the calls.
You can load, unload, and reload an engine, i.e., unload and immediately reload it.
You can load an updated version of an engine by pressing Update. This version must be located in the server\Update\new directory. The server unloads the affected engine and replaces the current version with the updated version by loading it.
If you work with more than one server, you will need to update the engines of all servers.
Monitoring
The Monitoring area provides information on connections to clients and servers, on job queues and job calls, and also allows you to view and send notifications to clients.
Connections/Active Clients
This area lists all current connections to clients.
The list includes the times at which a connection has been established and the last job has been executed.
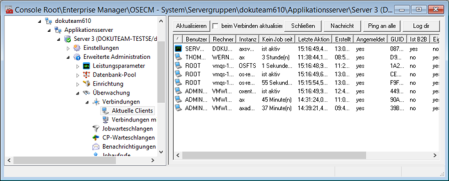
You can terminate selected connections using the Close button. The affected clients will establish a new connection when the next job is to be performed.
Press Ping to all to send a ping to all clients. You will receive the results of the ping.
The Queue button displays how many messages in the queue have not been processed yet.
With the Notify button you can send a message to the selected clients or close them.
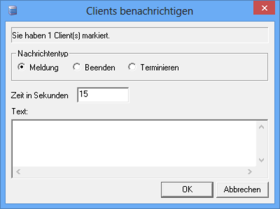
The following options are available:
- Send message to selected clients
Enter the text and specify how long the message will be displayed in the client application.
- Exit selected clients
Enter the text and specify the time period until the client will exit.
Once the specified time period has expired, the selected clients will exit and all checked-out documents will be checked in.
- Terminate selected clients
Enter the text and specify the time period until the client will exit.
There may be cases where the client cannot execute the exit command. You can use the Terminate feature to shut down client applications. Checked-out documents may not be checked in and temporary files may not be deleted.
Terminating client applications may cause the loss of data.
In multi-server systems, a server can only inform clients that are connected to that specific server.
Use the Log dir button to transfer the log of a selected client.
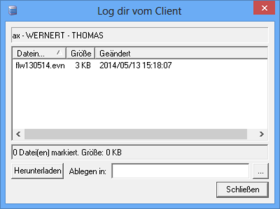
Select the logs you want to transfer, specify a directory, and click Download.
Connections to Other Servers
In this area, all of the server family's current connections to other servers are listed.
What is shown is when a server connection was created. You can close connections and send a ping.
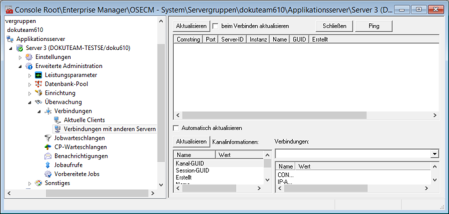
To see all connection details in the lower area, select a server connection.
Job Queues
All job queues can be viewed here, allowing you to estimate the current workload based on the parameters.
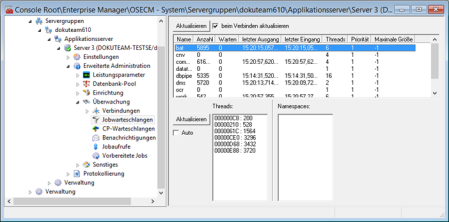
If you mark a queue, you can view the threads below. The engines assigned to the queue will also be listed.
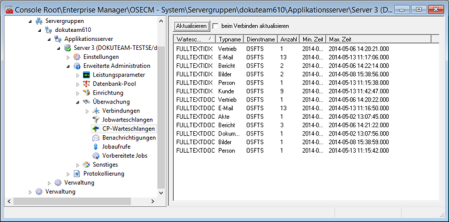
CP Queues
In this area the jobs which process the messages in the CPB queues are displayed.
Here, you can see the service instances that have checked out one or more CPB messages for editing. The Min. time and Max. time columns indicate at what time the first and the last message were checked out by a service.
If no service name is assigned to a job, messages are available that are not yet processed by a service.
Notifications
This area displays the notifications received by the server.
You can enter the maximum number of notifications in the Number field. If you select Pause, no messages will be received.
Use the Delete button to delete all messages.
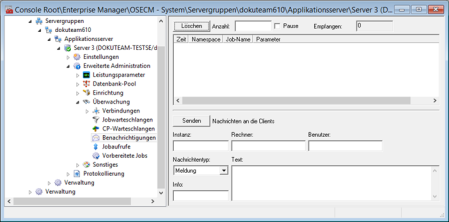
You can also send and close messages to clients.
Parameters:
|
Instance |
The enaio® application to which the messages will be sent. Example: ax |
|
Computer |
The name of the computer to which the message will be sent. |
|
User |
The enaio® user to whom the message will be sent. |
|
Message type |
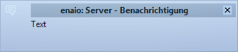
Three types of messages can be sent: Notification – A message containing the contents of the 'Text' field will be displayed.
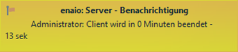
Exit – the application will be closed after the specified time has expired. A message containing the contents of the 'Text' field will be displayed.
The time remaining until the program is closed will be displayed. The exit option corresponds to the 'Close' user action in enaio® client. If a modal dialog is open in the application, the application can only be forced to close by sending a Terminate message. Terminate – a message with the value of the 'Text' parameter will be shown. The application will be closed even if a modal dialog is open.
|
|
Text |
This text will be displayed in the message. When the user clicks on the text entry, a window opens containing all messages sent during the current session. |
|
Info |
To exit and terminate messages, enter the number of minutes before the program closes here. After the specified time has expired, the message will close automatically. |

The parameters Computer, Instance, and User are combined using a logical AND. Only one value can be entered for each parameter. No entry means 'send to all'.
Use the Send button to carry out the corresponding action.
These functions can also be run as periodic jobs in the Monitoring > Connections > Active clients area.
In multi-server systems, a server can only inform clients that are connected to that specific server.
enaio® webclient users will not be informed.
Job Calls
You can monitor the job calls of one or any number of senders here.
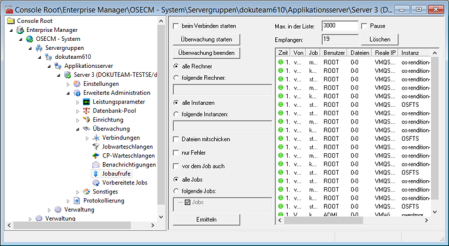
Specify one or several computers, separated by semicolons, or choose All computers.
Specify one or several instances to be monitored, i.e., enaio® components, separated by semicolons, or choose All instances. Instance names of individual enaio® components are transferred to enaio® server at startup and can be found in the Instance column.
Then decide whether to monitor all jobs or only selected ones. Mark all the jobs you want to monitor from the list. They are listed by engine.
For job monitoring, you can specify that only the  errors are listed. If you select Additionally before the job, all
  job calls that only have input parameters will be listed.
Activate the Enclose files option to copy all files which are sent with jobs to the temporary directory. The path is specified in the configuration dialog.
The jobs listed on the right are accordingly flagged with icons to indicate the type of entry.
Then click Start monitoring. Settings will be applied and the respective job calls listed.
If you activate the Start at connection option, job monitoring will be started when enaio® enterprise-manager is launched.
Enter the upper limit on the number of current job calls that will be shown in the Max. entries in the list field. The 'Pause' option permits you to temporarily halt the recording.
Double-clicking an item in the list will open the job's properties dialog:
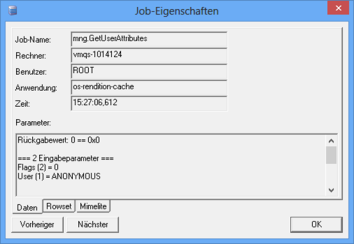
You will find a list of the input parameters as well as the return values of successful and failed jobs in the Parameters area on the Data tab.
If the Enclose files option is activated, you can find the path to the related file here.
The Rowset tab shows SQL statements and the results of the selected jobs.
You can decode MIME encoded data on the Mimelite tab.
For reasons of clarity, the calls to periodic jobs and their details are not displayed in this area. In order to facilitate analytics and debugging, for example, during workflow development, periodic job calls can be sent to enaio® server. To do so, go to Settings > Registry entries and change the value of the string Schema\MonitorBatchCallsToo to '1'. Sending job calls to enaio® server is disabled by default.
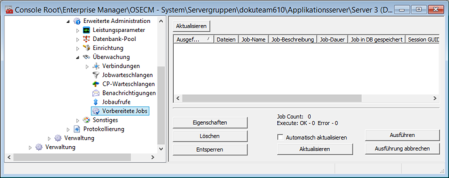
Prepared Jobs
Jobs to be initialized via scripts or other customized contexts and carried out by enaio® server can be parameterized in such a way that they are performed at a specific point of time.
These jobs are listed here. You may customize how the job is performed:
- Execute
The prepared job will be performed instantly.
- Cancel
Execution of a prepared job is canceled.
- Delete
The prepared job will be deleted.
- Unlock
Job data are locked in order to exclude multi-access issues. If a performance error occurs while the job is locked, you can unlock and run the job.
Miscellaneous
Persistent Storage
The server's last ten start and stop processes are entered in the database.
This data can be viewed here.
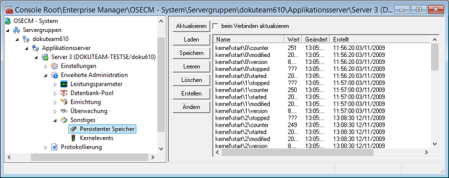
The entries in this area do not have any influence on the system's functions.
Kernel Events
Here you can subscribe to information on kernel events. The server will inform enaio® enterprise-manager about these events, and enaio® enterprise-manager will then automatically update the corresponding data in the relevant settings areas.
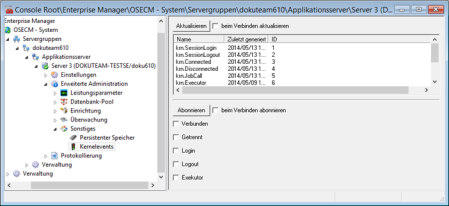
 areas. Use the toolbar to show all hidden areas at once:
